dev.phpray/phpray
Ask an agent why a PHP site is slow: every request with its SQL, HTTP calls, errors and N+1.
PHPRay
Every PHP request, recorded. Find out which plugin, which query, and since when.
PHPRay is always-on request tracing for PHP. It records wall time, CPU, memory, SQL, outbound HTTP, errors and N+1 patterns for every request, not a sample, and on a small share of requests it adds a per-plugin / per-component time breakdown.
It is a PHP extension plus a local collector. No agent that needs root, no network egress from the PHP process, no SaaS account required. It runs on shared hosting (CageFS, LiteSpeed lsphp, mod_php), on a VPS and in containers, on PHP 8.0–8.5, glibc and musl, amd64 and arm64.
curl -fsSL https://phpray.dev/install.sh -o phpray-install.sh
less phpray-install.sh          # it asks for root; read it first
sudo bash phpray-install.sh && phpray top
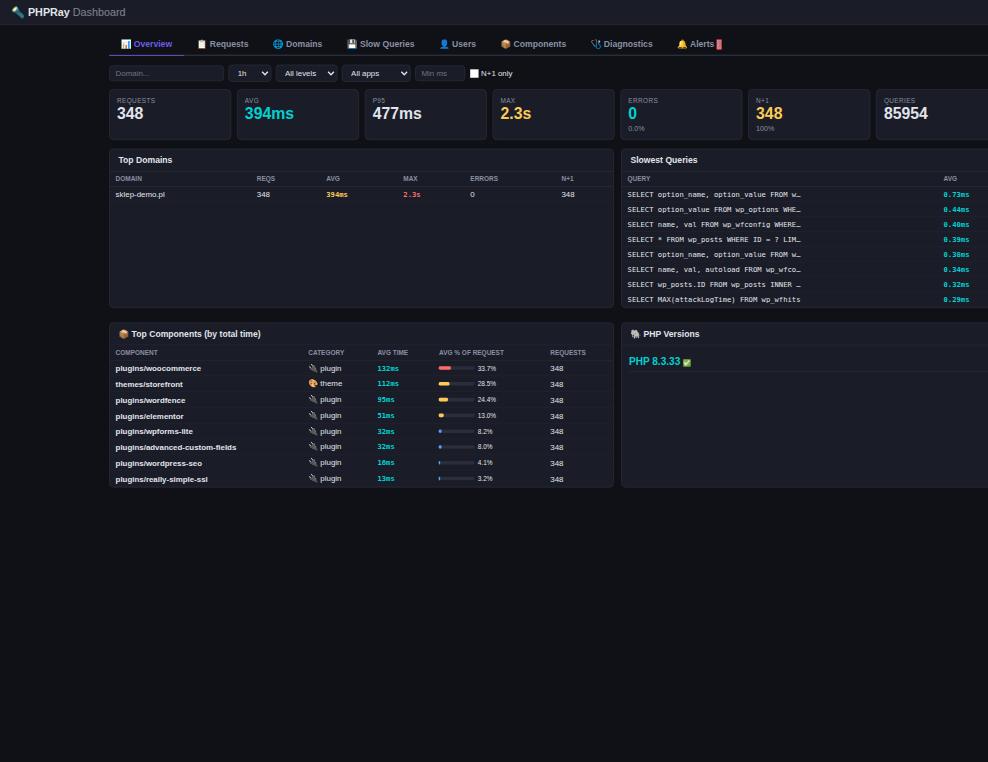
What it looks like
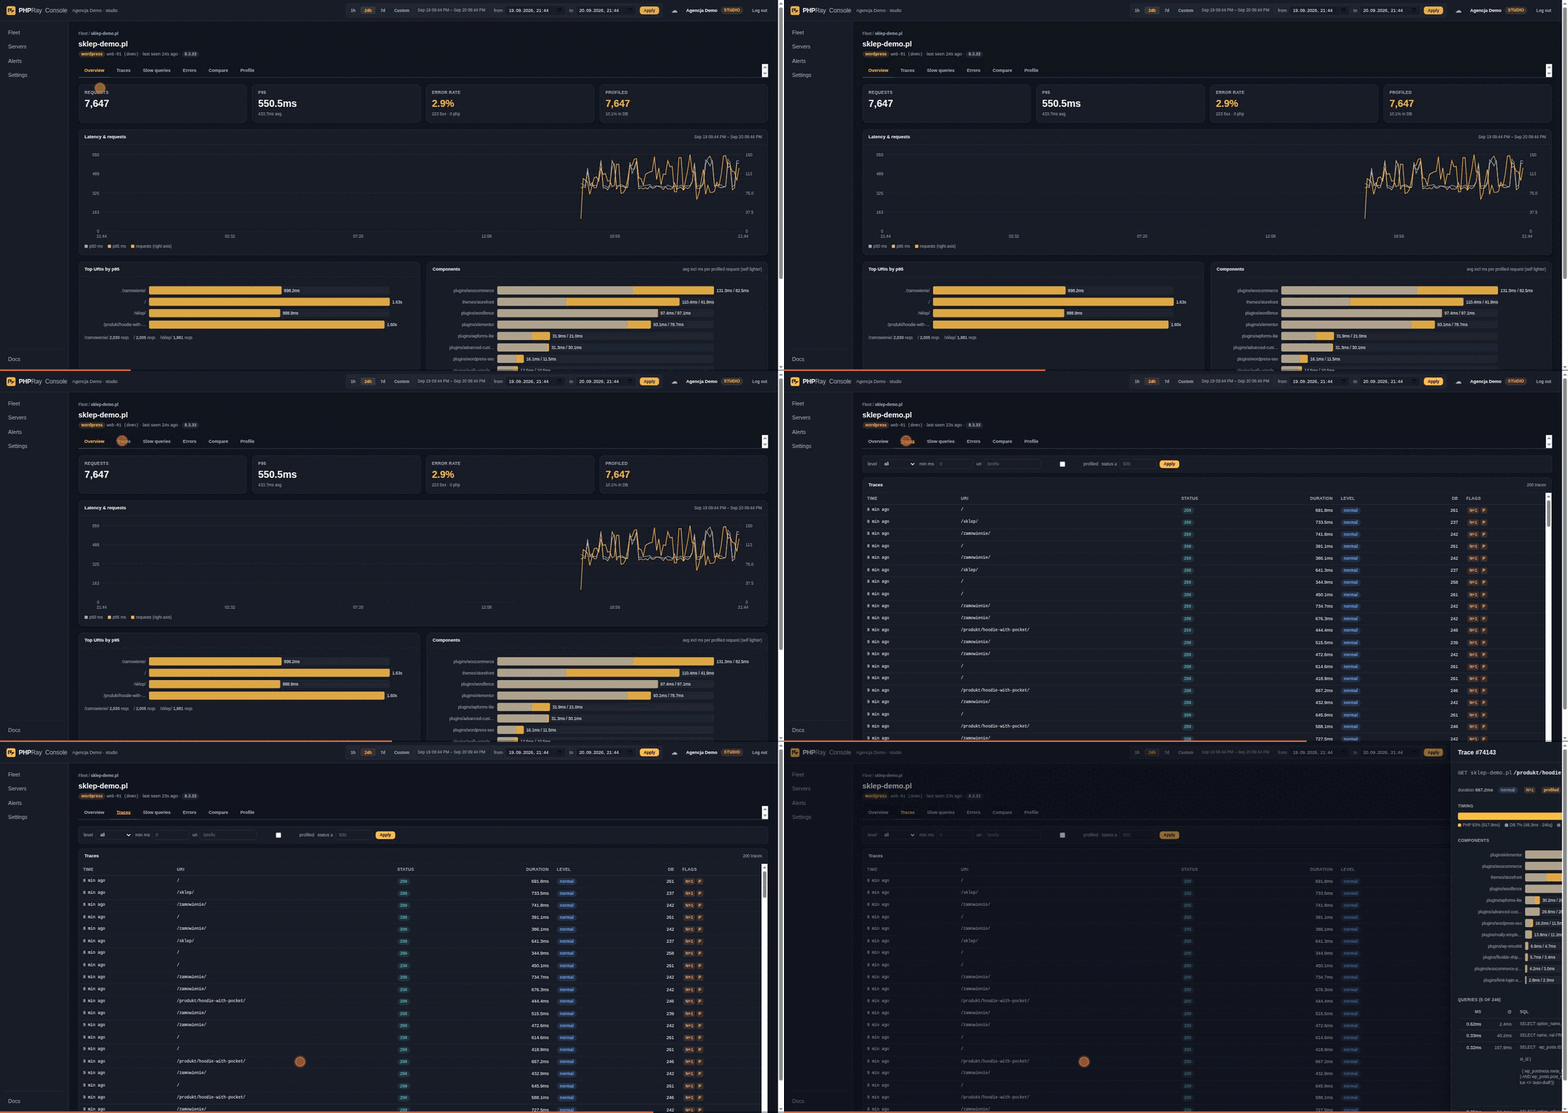
PHPRay Cloud: every site, then one site, then one 887 ms request broken into PHP and database time, the plugins that spent it, and the queries behind it. Demo data.
The question it answers
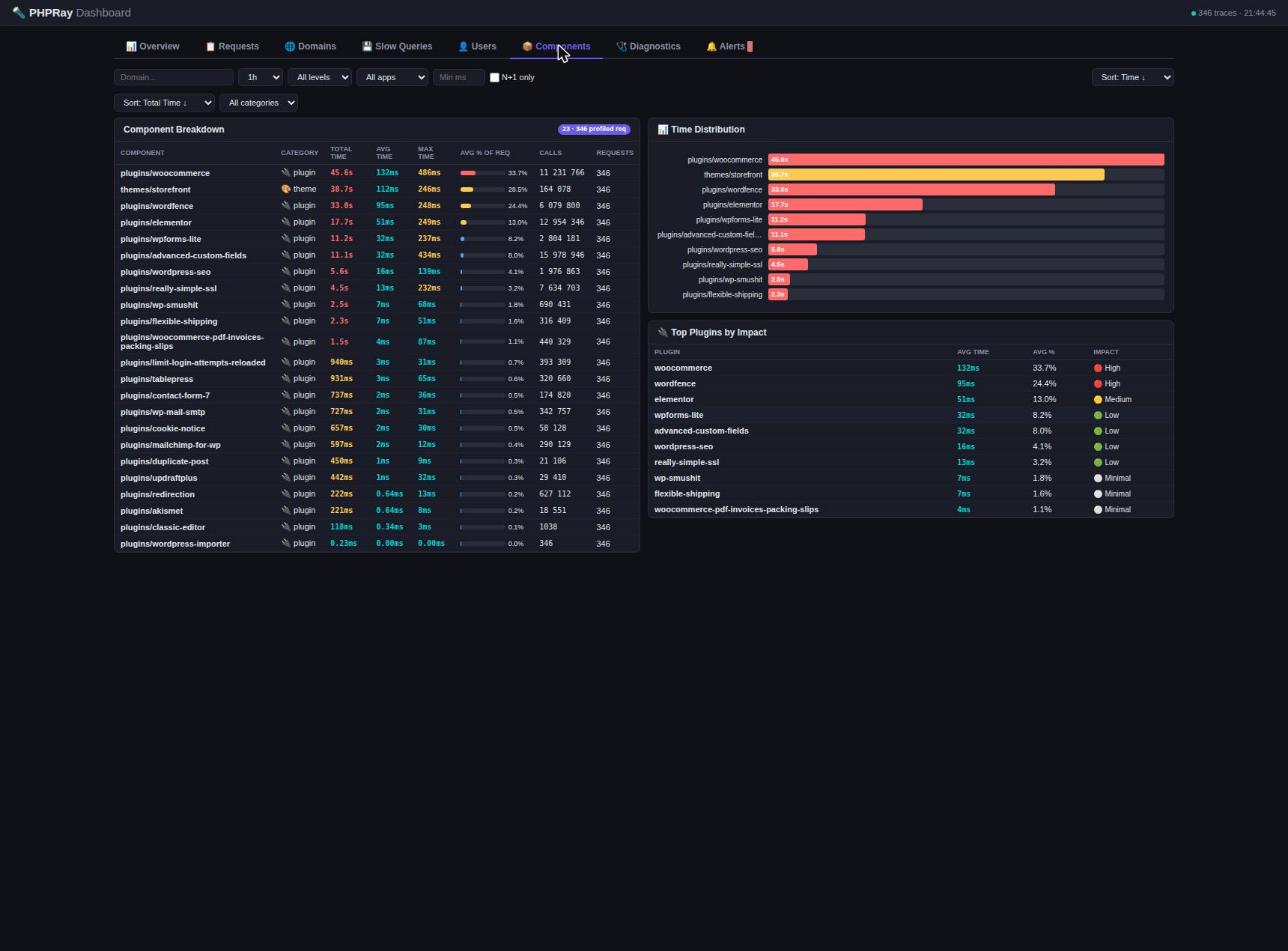
"The store got slow last week" is not actionable. PHPRay turns it into a named plugin, a named query and the day it changed:
Why another profiler
- Every request, not a sample. Sampling agents keep statistics between samples. PHPRay writes one record per request, so the single failing checkout and the error that fired once are still there when you look.
- Cheap enough to leave on, and we measured it. On a WordPress page rendering in 48 ms, tracing with the function observer off could not be separated from the baseline across five interleaved rounds; with the observer on, the default today, the page took 50 ms. Method, raw numbers and caveats: the benchmark. Xdebug instruments every function call, which is why you only turn it on deliberately.
- The expensive part is sampled on purpose. Per-function profiling runs on 3 % of
requests by default. Measuring every call of every request on production traffic
would cost more than the traffic itself. Note the honest catch: the observer that
makes this possible is registered for every request, which is where the 2 ms above
comes from. Set
phpray.profile_functions=0if you want the cheapest possible always-on layer and turn the breakdown on only when investigating. - Built for shared hosting, and you can install it yourself. No daemon owning
system resources, no agent binary. The extension talks to a local collector over
shared memory or a flat file. If your host lets you edit your own
php.ini— cPanel MultiPHP INI Editor, CloudLinux PHP Selector, Plesk — you can pointextension=at a.soin your home directory and run the collector as your own user. No root, no compiler, nobody's permission. Verified end to end as uid 1000; the cases where it does not work are listed in the docs.
Who builds it
Built by IQhost, a European hosting provider running PHP for thousands of sites. That is where PHPRay is developed and where it is deployed first: the shared-hosting constraints in this README are not hypothetical, they are the environment the extension has to survive in every day.
Ask an agent what is slow
PHPRay ships an MCP server, so a coding agent can read your traces and answer "which plugin is slowing this page down" without you opening a dashboard.
Try it with nothing installed and no account — you get a read-only demo account with a real WooCommerce store's recorded traffic:
claude mcp add --transport http phpray https://phpray.dev/mcp
Then ask: which pages are slowest, which SQL fingerprint costs the most, which
plugin eats the time. Add --header "Authorization: Bearer <console token>"
and the same tools read your own sites instead.
Or run it locally as a binary over stdio:
# pick your platform: linux-amd64, linux-arm64, darwin-amd64, darwin-arm64
curl -fsSL -o phpray-mcp "https://phpray.dev/dl/$(curl -fsS https://phpray.dev/dl/LATEST)/phpray-mcp-linux-amd64"
chmod +x phpray-mcp && sudo mv phpray-mcp /usr/local/bin/

# every server in one place, scoped to your console token
claude mcp add phpray --env PHPRAY_TOKEN=<console token> -- phpray-mcp

# or just this machine's collector, no account needed
claude mcp add phpray-local -- phpray-mcp
In cloud mode the token is your console token, so the agent sees exactly the sites it is scoped to. In local mode it reads the collector on the same box and needs no account at all.
Ten read-only tools — sites, overview, slowest pages, slow SQL, component
breakdown, errors, traces, one trace in full, before/after comparison, alerts —
plus an eleventh, phpray_profile_url, which turns per-function profiling on
for a URL prefix. That one changes state, so the public demo endpoint does
not offer it: without a token tools/list returns ten. With your own console
token, or locally over stdio, you get all eleven. Source and protocol notes:
src/mcp/.
Free and paid
Everything in this repository is free and open source under Apache-2.0: the extension, the collector, the CLI, the local dashboard and the panel plugins. It is a complete product on its own, on one server, forever.
PHPRay Cloud is the paid part: many servers in one place, history beyond your disk, alerting and the hosting-panel console. It is a separate, closed codebase. Nothing here phones home to it unless you configure a server key yourself.
Quick start
curl -fsSL https://phpray.dev/install.sh -o phpray-install.sh
less phpray-install.sh
sudo bash phpray-install.sh
phpray status
Piping an installer straight into a root shell is a habit worth not having, ours
included: download it, read it, then run it. The checksums of everything it
fetches are published next to the files, under
https://phpray.dev/dl/<version>/SHA256SUMS, and the installer verifies them.
The installer detects every PHP version on the host, installs the prebuilt phpray.so for each of them, deploys the collector with its systemd unit, and reloads the PHP pools. It is a single binary with zero external dependencies.
Manual install
If you prefer to place the pieces yourself:
# 1. drop the prebuilt extension into your PHP extension dir
sudo cp phpray.so /usr/local/lib/php/extensions/no-debug-non-zts-20240924/

# 2. enable it (Debian layout shown; use your distro's conf.d)
echo "extension=phpray.so" | sudo tee /etc/php/8.3/fpm/conf.d/99-phpray.ini
sudo systemctl reload php8.3-fpm

# 3. run the collector
sudo /usr/local/bin/phpray-collector serve -addr :9191
Verify
php -m | grep phpray                       # "phpray" is listed
curl -sI https://yoursite.com              # X-PHPRay-ID: pr-... response header
CLI
phpray status        # extension loaded, collector running, recent volume
phpray top           # live slowest requests, htop-style
phpray trace         # per-request waterfall (queries, HTTP calls, components)
phpray diag shop.pl  # health score + findings + recommendations
A report you can send to someone else
The one PHPRay artefact regularly read by people who never installed it: an agency sends it to the shop owner, an administrator pastes it into a ticket.
phpray report -domain shop.example -w 1440 -format html -o report.html
phpray report -domain shop.example -format html -anonymize -o public.html
One self-contained file — no external requests, no fonts, no scripts — with the
health score, what was found, what it costs and what to do about it. With
-anonymize the domain is replaced everywhere, including inside the findings and
the evidence, so the same report can go on a forum or into a proposal.
What a trace contains
Every request produces one JSON record. A request that has also been function-profiled carries "profiled": 1 and a components array with incl_ns, self_ns and calls per component:
{
  "ts": 1774713671,
  "host": "shop.example.com",
  "method": "GET",
  "uri": "/checkout",
  "status": 500,
  "duration_ms": 2411.7,
  "cpu_user_ms": 188.4,
  "memory_peak_mb": 96.2,
  "app": "wp",
  "level": "full",
  "db_count": 142,
  "queries": [
    { "sql": "SELECT * FROM wp_posts WHERE ID = ?", "ms": 12.4 }
  ],
  "http_calls": [
    { "url": "https://api.stripe.com/v1/checkout/sessions", "ms": 1842.9, "status": 200 }
  ],
  "errors": [
    { "type": "E_WARNING", "msg": "Division by zero", "file": "/wp-content/plugins/xyz/fee.php", "t": 1903.1 }
  ],
  "n1": 1,
  "profiled": 1,
  "components": [
    { "name": "plugins/woocommerce", "incl_ns": 1430221, "self_ns": 902114, "calls": 1874 },
    { "name": "themes/storefront",   "incl_ns": 612009,  "self_ns": 504002, "calls": 913 },
    { "name": "core",                "incl_ns": 421778,  "self_ns": 388001, "calls": 1204 }
  ]
}
incl_ns is the time spent inside a component (including any core or other PHP it calls); self_ns excludes nested components; calls is the number of observed function calls in that component.
Configuration
The six directives you are most likely to touch. PERDIR means it can be overridden per site or directory; SYSTEM means it must be set in php.ini.
phpray.enabled            = 1        ; PERDIR — master switch
phpray.profile_mode       = sample   ; PERDIR — off | sample | url | all
phpray.profile_sample_rate= 3        ; PERDIR — % of requests function-profiled in "sample"
phpray.profile_url        = /cart    ; PERDIR — URI prefixes to profile in "url" mode
phpray.profile_functions  = 1        ; SYSTEM — register the observer at all (0 = zero cost)
phpray.output_mode        = shm      ; SYSTEM — file | shm | both
The remaining directives (smart-sampling thresholds, ignored URIs, ring-buffer size, header emission, …) are documented in docs/.
Per-site control under Apache (mod_php / LiteSpeed) or with a .user.ini on the right pool:
# .htaccess — mod_php only
php_value phpray.profile_mode url
php_value phpray.profile_url /checkout
; .user.ini — PHP-FPM / LiteSpeed
phpray.profile_mode = sample
phpray.profile_sample_rate = 5
All hooks (MySQL/curl/file, the error callback and the observer) are installed at MINIT regardless of phpray.enabled, so a single site can be enabled on a globally disabled server; the only way to run without the observer at all is phpray.profile_functions = 0. JSONL records are written with one write() on an O_APPEND descriptor, so concurrent workers never interleave lines.
Overhead
The always-on tracing layer is designed to add as little as possible on the hot path. The figures are measured on a real WooCommerce test store (Storefront theme, 22 active plugins, PHP 8.3 with OPcache) with and without the extension, never on synthetic scripts; the full methodology — workload, environment, how each number was taken and its margin of error — is in docs/.
Status (September 2026): internal runs on a laptop put the always-on layer within the measurement noise of the bare-PHP baseline, and profiling of every request measurably above it, yet far below what a classic execute_ex hook costs. We do not publish those as product figures. Certified numbers, the methodology and the raw data will follow the benchmark on a dedicated, quiet host.
Architecture
 PHP process
   └─ phpray.so (hooks RINIT/RSHUTDOWN, mysqli/PDO, curl, files, errors, observer)
         │
         └─► ring buffer (/dev/shm)  and/or  JSONL file
                   │
                   ▼
        phpray-collector (single Go binary, systemd unit)
         ├─► SQLite (traces, queries, components, 1-min aggregates, retention)
         ├─► REST API  /api/v1/*  +  embedded dashboard
         └─► (optional) PHPRay Cloud ingest
Plugins
Both live in their own repositories, because they have their own release cycles and, in WordPress's case, its own licence.
WordPress (GPLv2+). If you
cannot load a PHP extension — hosted shared hosting, PaaS — the plugin is a
pure-PHP collector: it hooks $wpdb, the HTTP API and the error handler, and
sends the same trace format to your local collector or to PHPRay Cloud. You get
the always-on layer (timing, SQL, HTTP, errors, N+1) without the extension, and
the README is explicit about the four things it cannot see.
DirectAdmin (Apache-2.0).
A panel plugin with two views: customers see their own domains, the administrator
sees the whole server. On CloudLinux it can switch the extension on or off per
account, which .user.ini cannot do — PHP reads per-directory values long after
module startup. Customers also get "profile this URL prefix for N minutes" without
SSH.
PHPRay Cloud
Host Edition customers and anyone who wants a hosted console can send traces to PHPRay Cloud: multi-domain fleet view, retention and history, alerts, and white-label diagnostic reports for clients. Plans: Free, Solo 19, Studio 99, Agency 249, Fleet 499 USD per month; Host Edition is billed yearly. See https://phpray.dev/pricing. The PHP extension and the local collector remain free and open source — the cloud is an optional destination, not a dependency.
Building from source
# extension
cd src/extension
phpize && ./configure --enable-phpray && make -j$(nproc) && sudo make install

# collector
cd src/collector
go build -o phpray-collector .
Contributing
We use the Developer Certificate of Origin (DCO). Sign off each commit with git commit -s. Open an issue before large changes.
Security
To report a security issue, email security@phpray.dev (PGP on the website). Please do not open a public issue.
License
Apache License, Version 2.0 — see LICENSE.
Trademark
"PHPRay" is a trademark of IQhost. The extension, the collector, and this repository are licensed as stated above; the trademark is not granted.
Built by IQhost — a European hosting provider running PHP for thousands of sites, which is where PHPRay is developed and first deployed.
Setup from the maintainer
This listing does not have a supported local package template. Use the maintainer’s documentation for its hosted endpoint, authentication, and client-specific setup. No install command has been inferred.