com.super-log/super-log
Query your local super-log bench from an AI agent - read-only log tools over the hub.
 # super-log


One hub for every log stream you have — devices, servers, containers, browsers, chains and apps.
This project is a consolidation of a patchwork of tools I have used, in one form or another, over the last fifteen years — the log mergers, port watchers, build wrappers, ad-hoc proxies and one-off scripts every long-running bench accumulates — rebuilt here as one coherent thing, on one wire protocol, with one screen.
Free and self-hosted, forever. It collects and consolidates; analysis is a separate, cleaner concern — hand the consolidated stream to super-log.com for real-time LLM analysis and team features, or to your own store. See Collection is not analysis.
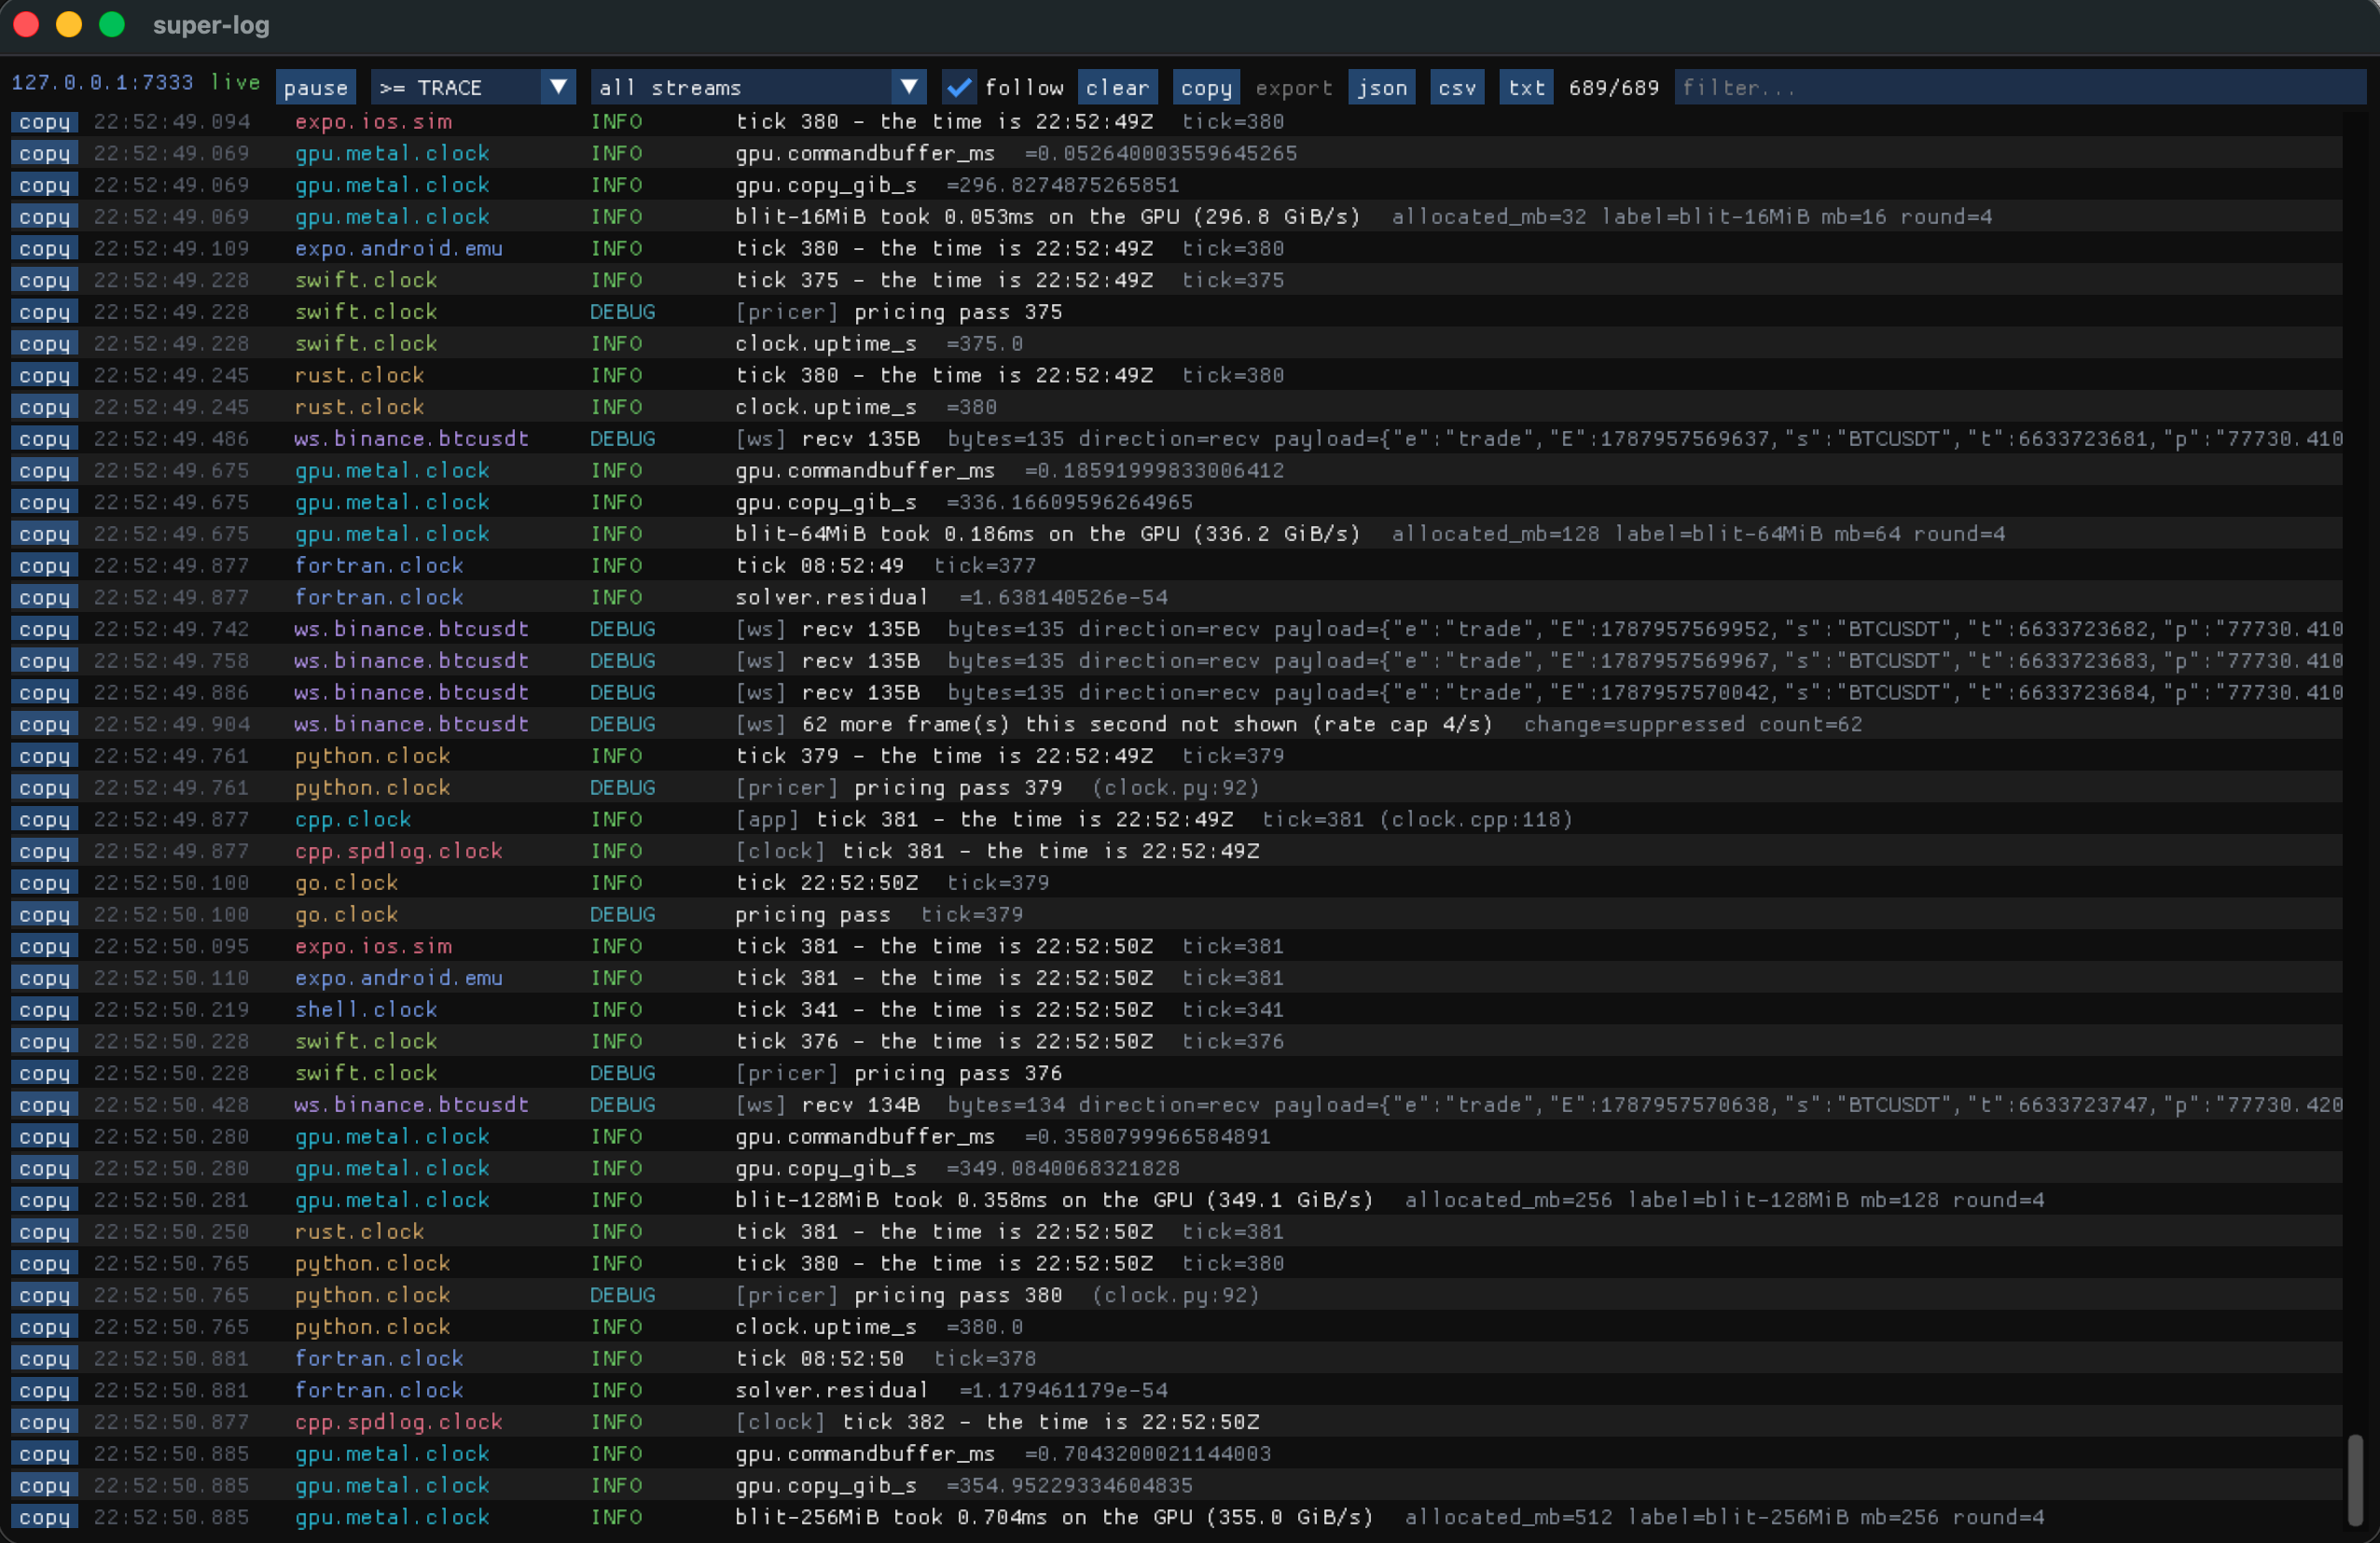
Twelve producers on one screen, interleaved by arrival: C++ through both SN_LOG and spdlog, Rust, Go, Python, Swift, Fortran, a POSIX shell script, two React Native devices, Metal GPU work reporting real bandwidth, and a live Binance WebSocket. The last of those is running at hundreds of frames a second — so it is rate-capped, and says so rather than silently dropping them.
If you build across devices, you know the ritual: a Metro console for the
iOS simulator, another for the Android emulator, adb logcat for the phone
on your desk, a terminal for the C++ engine, another for the Rust service,
browser devtools for the web build, and an ssh session to the box in the
cloud. Six places to look, none agreeing on timestamps, and the bug is
always in the interleaving.
super-log converges all of it on one process and one screen:
 apps, 14+ languages ┐
 GPU and graphics    │
 devices and boards  │                                     ┌─▶ native viewer (ImGui)
 machines, services  ├── POST NDJSON ──▶  superlogd :7333 ─┼─▶ web viewer (React)
 network and DNS     │                    (fan-out+replay) ├─▶ journal → search / replay
 builds and repos    │                                     ├─▶ GET /recent  (scripts)
 blockchain          │                                     ├─▶ MCP tools    (agents)
 anything that prints┘                                     └─▶ alerts → webhook
| Group | What is in it |
|---|---|
| apps | C++ (spdlog sink and nativeSN_LOG), plain C (one header), C# / .NET (BCL only — console, ASP.NET, Unity profiles, Xbox Dev Mode), Rust (tracing), Python (logging), Go (log/slog), Java, Kotlin and Scala (java.util.logging), Swift, Fortran, OCaml, Haskell, Lean 4, Ruby and Rails (a drop-in ::Logger), Perl (core modules only), Lua (5.1+, PUC or LuaJIT), Zig (@cImport of the C header), COBOL (riding the C SDK, yes really), POSIX sh, and JS for Node, the browser and React Native — where console, fetch and WebGL are captured too. Anything else with a C FFI links one object: cc -DSUPERLOG_API= -c impl.c |
| OpenTelemetry | already instrumented with OTel? Join the bench with no new SDK — point any exporter at 127.0.0.1:4318 (OTEL_EXPORTER_OTLP_ENDPOINT, the standard port, zero config). Logs, metrics and traces over OTLP/JSON and OTLP/protobuf; severityNumber maps to levels, each service.name becomes an otlp.<service> topic, and an OTel span's trace_id becomes the bench's trace — one /recent?trace= returns the OTel spans and the bench's own lines as a single story |
| GPU and graphics | Metal and CUDA kernel timings, WebGL context loss and shader failures, and the card itself throughnvidia-smi, rocm-smi or ioreg |
| devices and boards | iOS and Android over USB, serial consoles reading ESP-IDF, Zephyr and bracketed formats, ROS 2/rosout, and drones over MAVLink (ArduPilot/PX4 — battery, GPS fix, mode/arm, failsafes and the flight controller's own STATUSTEXT, from a UDP stream or a .tlog) |
| machines, services | OS logs on macOS, Linux and Windows; ~20 known services (postgres, nginx, redis, kafka…); Unity and Unreal Engine editor logs, level-parsed (Blender and AutoCAD by recipe); Docker containers; any remote host over ssh; power draw, thermals and top energy consumers (macOS); crash reports, kernel panics, shutdown causes, volume and sleep/wake events (macOS); filesystem changes down to the changed LINES, diffed in real time; big downloads — a Hugging Face model, shard by shard — with stall alarms; other hubs, bridged whole; and every version under the bench — OS, compilers, runtimes, databases and every package the package manager knows — diffed, so "it worked yesterday" finally has an answer |
| network and DNS | an HTTP/S logging proxy, WebSocket frames, a syslog and raw TCP/UDP inlet, DNS records with TLS expiry, listening ports with their processes — and the network's ownstate, watched for change: gateway, Wi-Fi, VPN, resolvers, ARP (a gateway MAC change is ERROR — that is how a MITM starts), ping targets with RTT/loss readings and a traceroute attached to every degradation alarm, plus origin-AS watching of your domains' prefixes (what a BGP hijack looks like from outside); the LAN rendered as a tree with any route kept under watch, and the outbound connections this box holds — a socket stuck in SYN-SENT is the filtered/down port a dev loses an afternoon to |
| builds and repos | cmake, clang, gcc, rustc, swiftc, npm, xcodebuild, Vivado and Quartus — plus sanitizer and valgrind findings captured whole, local git, and GitHub Actions |
| blockchain | watched addresses on any EVM chain, with transfers decoded and token decimals read per contract; operational key balances with edge-triggered fund-now alarms - EVM (gas or ERC-20), Solana (SOL or SPL), Tron (TRX or TRC-20, USDT included), and Bitcoin (any Esplora API, your own node included) |
| trading, FIX | FIX session logs (QuickFIX, FIX8, or any engine that writes the standard message log): every message decoded from the SOH-delimited tag=value wire and levelled so the quiet failures shout — a Reject or a rejected fill is ERROR with its reason, a Logout or sequence gap is WARN (the session that stopped filling mid-day), a Heartbeat is DEBUG — with ClOrdID, Symbol, Side, OrderQty, Price and OrdStatus riding as fields; one fix.<begin>-<sender>-<target> topic per session, derived from the message itself, never the filename |
| anything that prints | your-command 2>&1 | superlog tee — a drop-in tee |
| alarms, webhooks | rules over the bench (level, rate, silence, combos) plus a tunnelled public webhook for production — deduped by key, repeat-counted, heartbeat dead-man — landing in both viewers' sparse alarm blotters, delivered through one channel registry (desktop, webhook; Telegram/Twilio/email config-gated); public endpoints provisioned one per click or many per manifest file, each with its own ping clock and health light, every route round-trip-tested by the test button, the live URLs written toendpoints.env; webhook testing built in — capture Stripe/GitHub deliveries as wh.* events, verify Stripe signatures on arrival, or relay each delivery to your local handler with its real response returned (stripe listen, with a record) |
Every producer speaks one small wire protocol (docs/PROTOCOL.md: one JSON event per line, batched over plain HTTP POST), the hub fans out to any number of readers with replay-on-connect, and everything is interleaved by hub sequence — not by device clocks, which drift.
Quick start
macOS — Homebrew:
brew install saxonnicholls/tap/super-log && brew services start super-log
Ubuntu (incl. Ubuntu Server on a Pi) — the PPA, every architecture, auto-updating:
sudo add-apt-repository ppa:super-log/stable && sudo apt update && sudo apt install super-log
Debian / Raspberry Pi OS — the .deb directly (PPAs are Ubuntu-only; don't
use add-apt-repository here). Pick your arch:
curl -fsSL -O https://github.com/saxonnicholls/super-log/releases/download/v0.4.0/super-log_0.4.0_arm64.deb   # or _amd64.deb
sudo apt install -y ./super-log_0.4.0_arm64.deb
Then see it work in two lines — the hub is already running on :7333:
echo "the bench is live" | superlog tee --topic hello
curl -s "http://127.0.0.1:7333/recent?topic=hello"
Fedora/RHEL, npm, vcpkg, building from source, and the web + native viewers are in Install below.
The superlog CLI
One command reads the bench, manages the tailers, and pipes streams onto the hub:
superlog status            what's running, and the hub's health
superlog alarms            firing alarms   (every read command is NDJSON when piped — | jq)
superlog versions          the version inventory, per host
superlog start vitals      start a tailer in the background
superlog stop vitals       stop it
superlog tee               a stream onto the hub   (make 2>&1 | superlog tee --topic build)
superlog login             open super-log Cloud in your browser
Full reference: docs/CLI.md. Or superlog help.
What it does for you
One screen, everything on it. Streams colour-coded by source and level, filtered by stream, minimum level or substring. Pause freezes the display while collection continues; copy a row or the whole filtered view; export JSON, CSV or plain text.
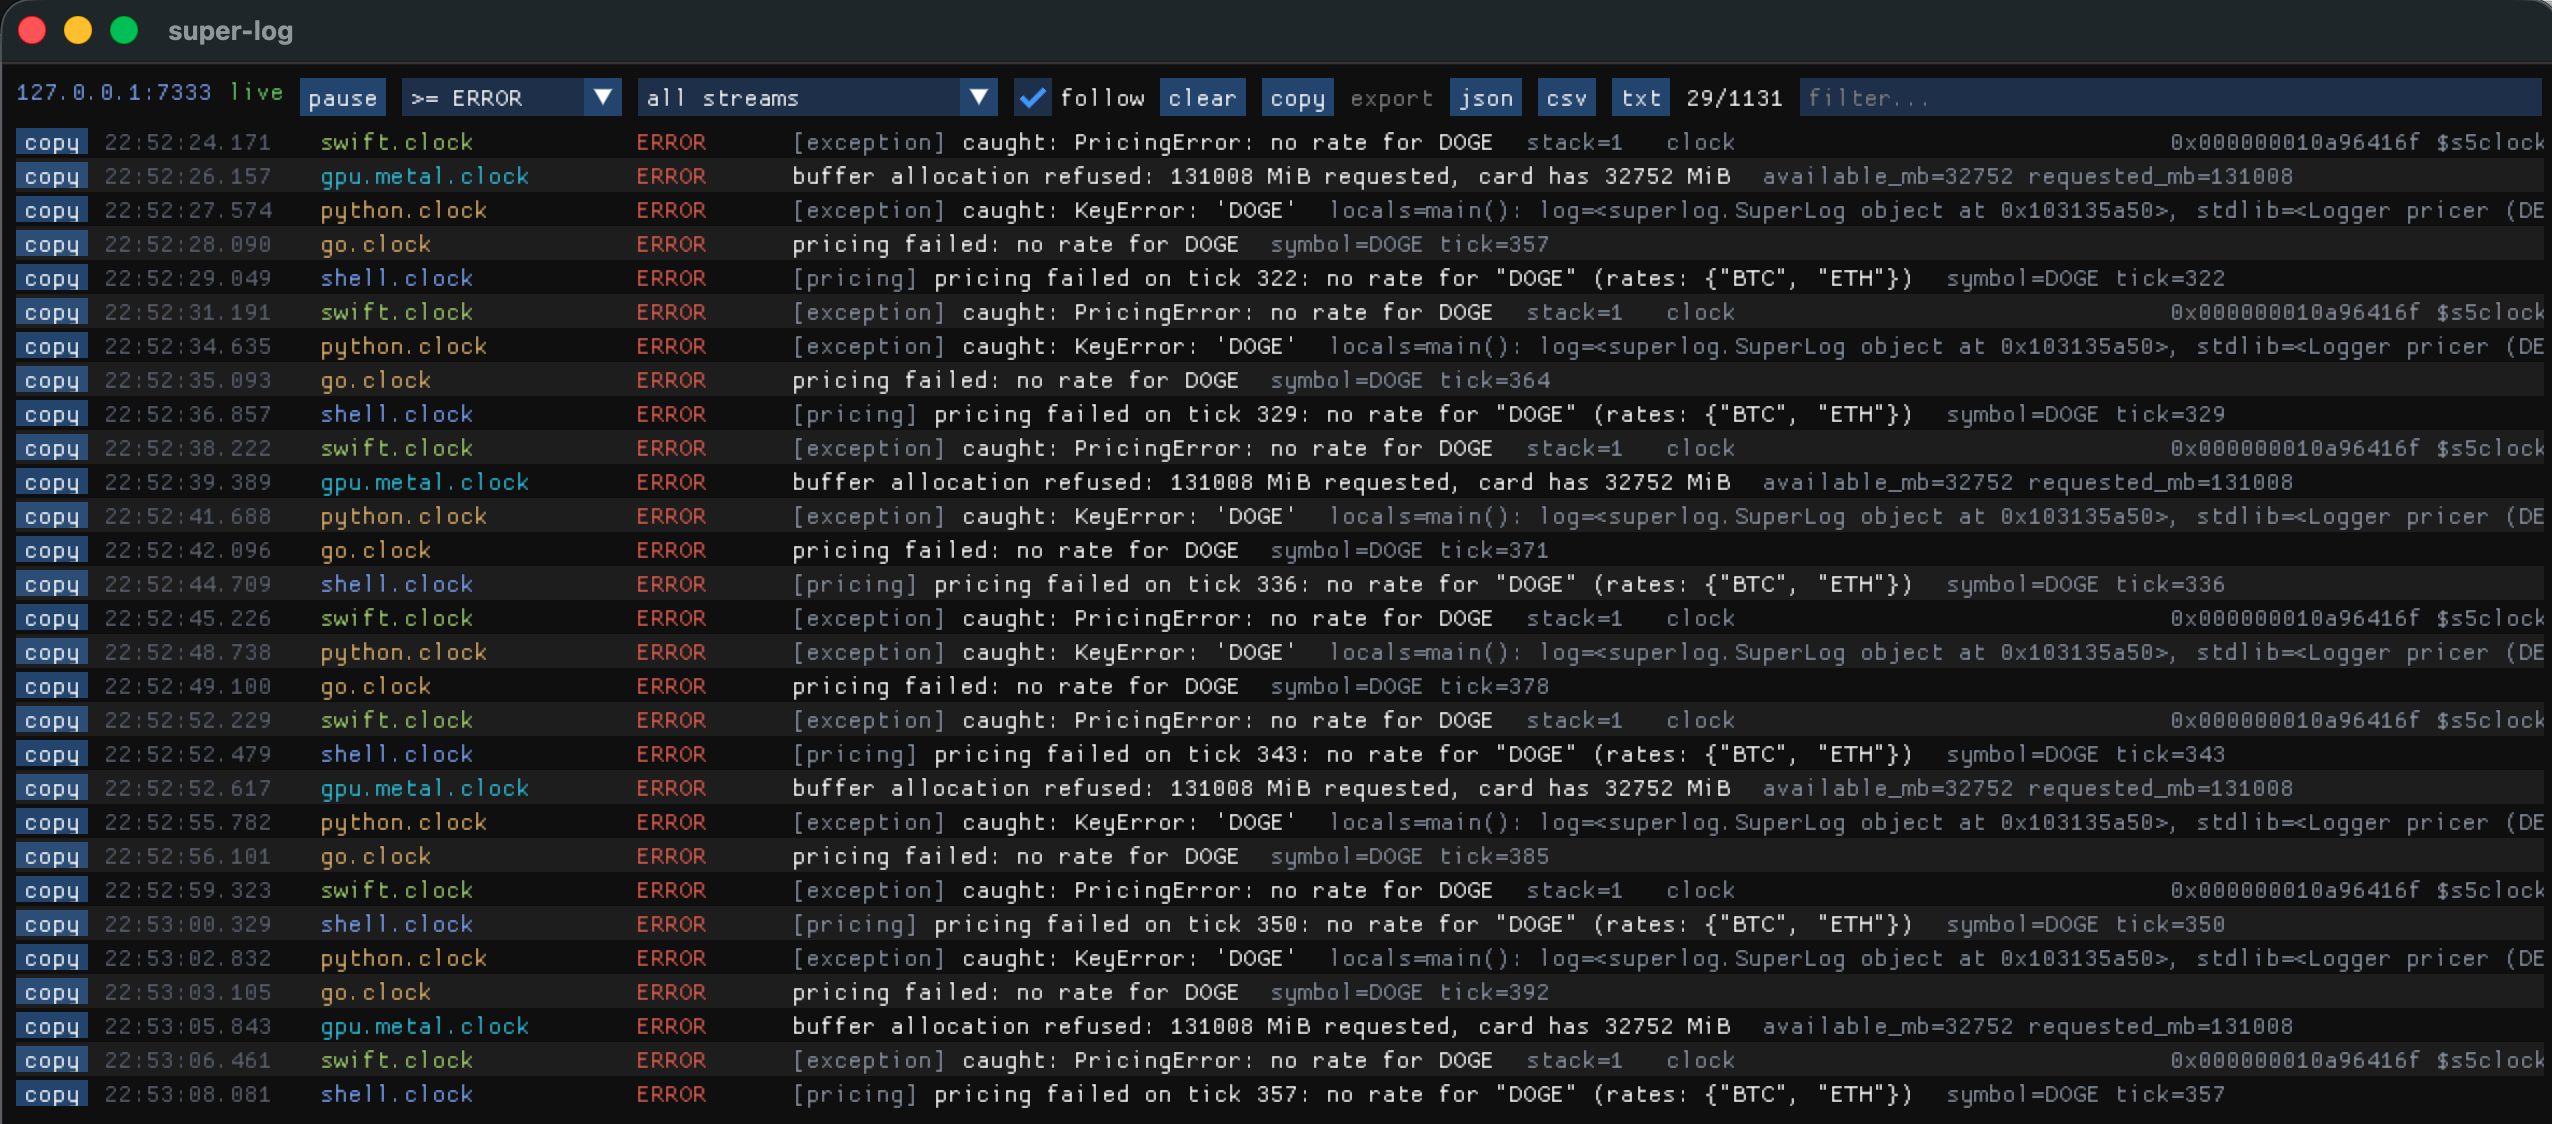
The minimum level set to ERROR: 29 rows out of 1131. The same pricing
failure surfaces from Swift, Python, Go and a shell script side by side —
each in its own language's idiom, a PricingError, a KeyError, a returned
error, a shell test — plus the GPU refusing an allocation four times the size
of the card. Python's row carries the local variables from the failing frame,
which is the part you would otherwise be adding a print statement to find.
Your apps need almost nothing. Fourteen dependency-free SDKs: header-only
C++ (both a spdlog sink and a native snicholls::log one), plain C in
one stb-style header — zero-alloc, and a production build provably contains
no logging at all — a Rust
crate with an optional tracing layer, Python plugging into stdlib
logging, Go with a log/slog handler, Java with a java.util.logging
bridge (Kotlin and Scala ride it, one import, zero glue), Swift, Fortran
over raw POSIX sockets, OCaml over the same raw sockets, Haskell needing
only GHC's boot libraries and curl, Lean 4 for the proof jobs that run
all night (core IO plus curl — Lean grew a kernel before it grew
sockets), Perl from core modules alone (HTTP::Tiny has shipped with
Perl since 5.14), Lua making the same curl bargain as the shell SDK
(Lua never grew sockets at all), C# from the BCL alone — everywhere .NET
goes, including Unity profiles and Xbox Dev Mode — Zig through @cImport
of the C header itself, COBOL through a 20-line C shim onto the
header-only C SDK, Ruby from the stdlib — with a
drop-in ::Logger adapter, which makes the whole Rails story one
config.logger assignment — a sh one-liner for scripts, and one JS
client for React Native, the browser and Node — patchConsole: true and
every console.log is on the bench.
Six of them hook the logging framework the language already has — the
spdlog sink, logging.Handler, slog.Handler, java.util.logging.Handler,
Ruby's ::Logger adapter and patchConsole — so everything a program
already logs reaches the bench without a single call site changing.
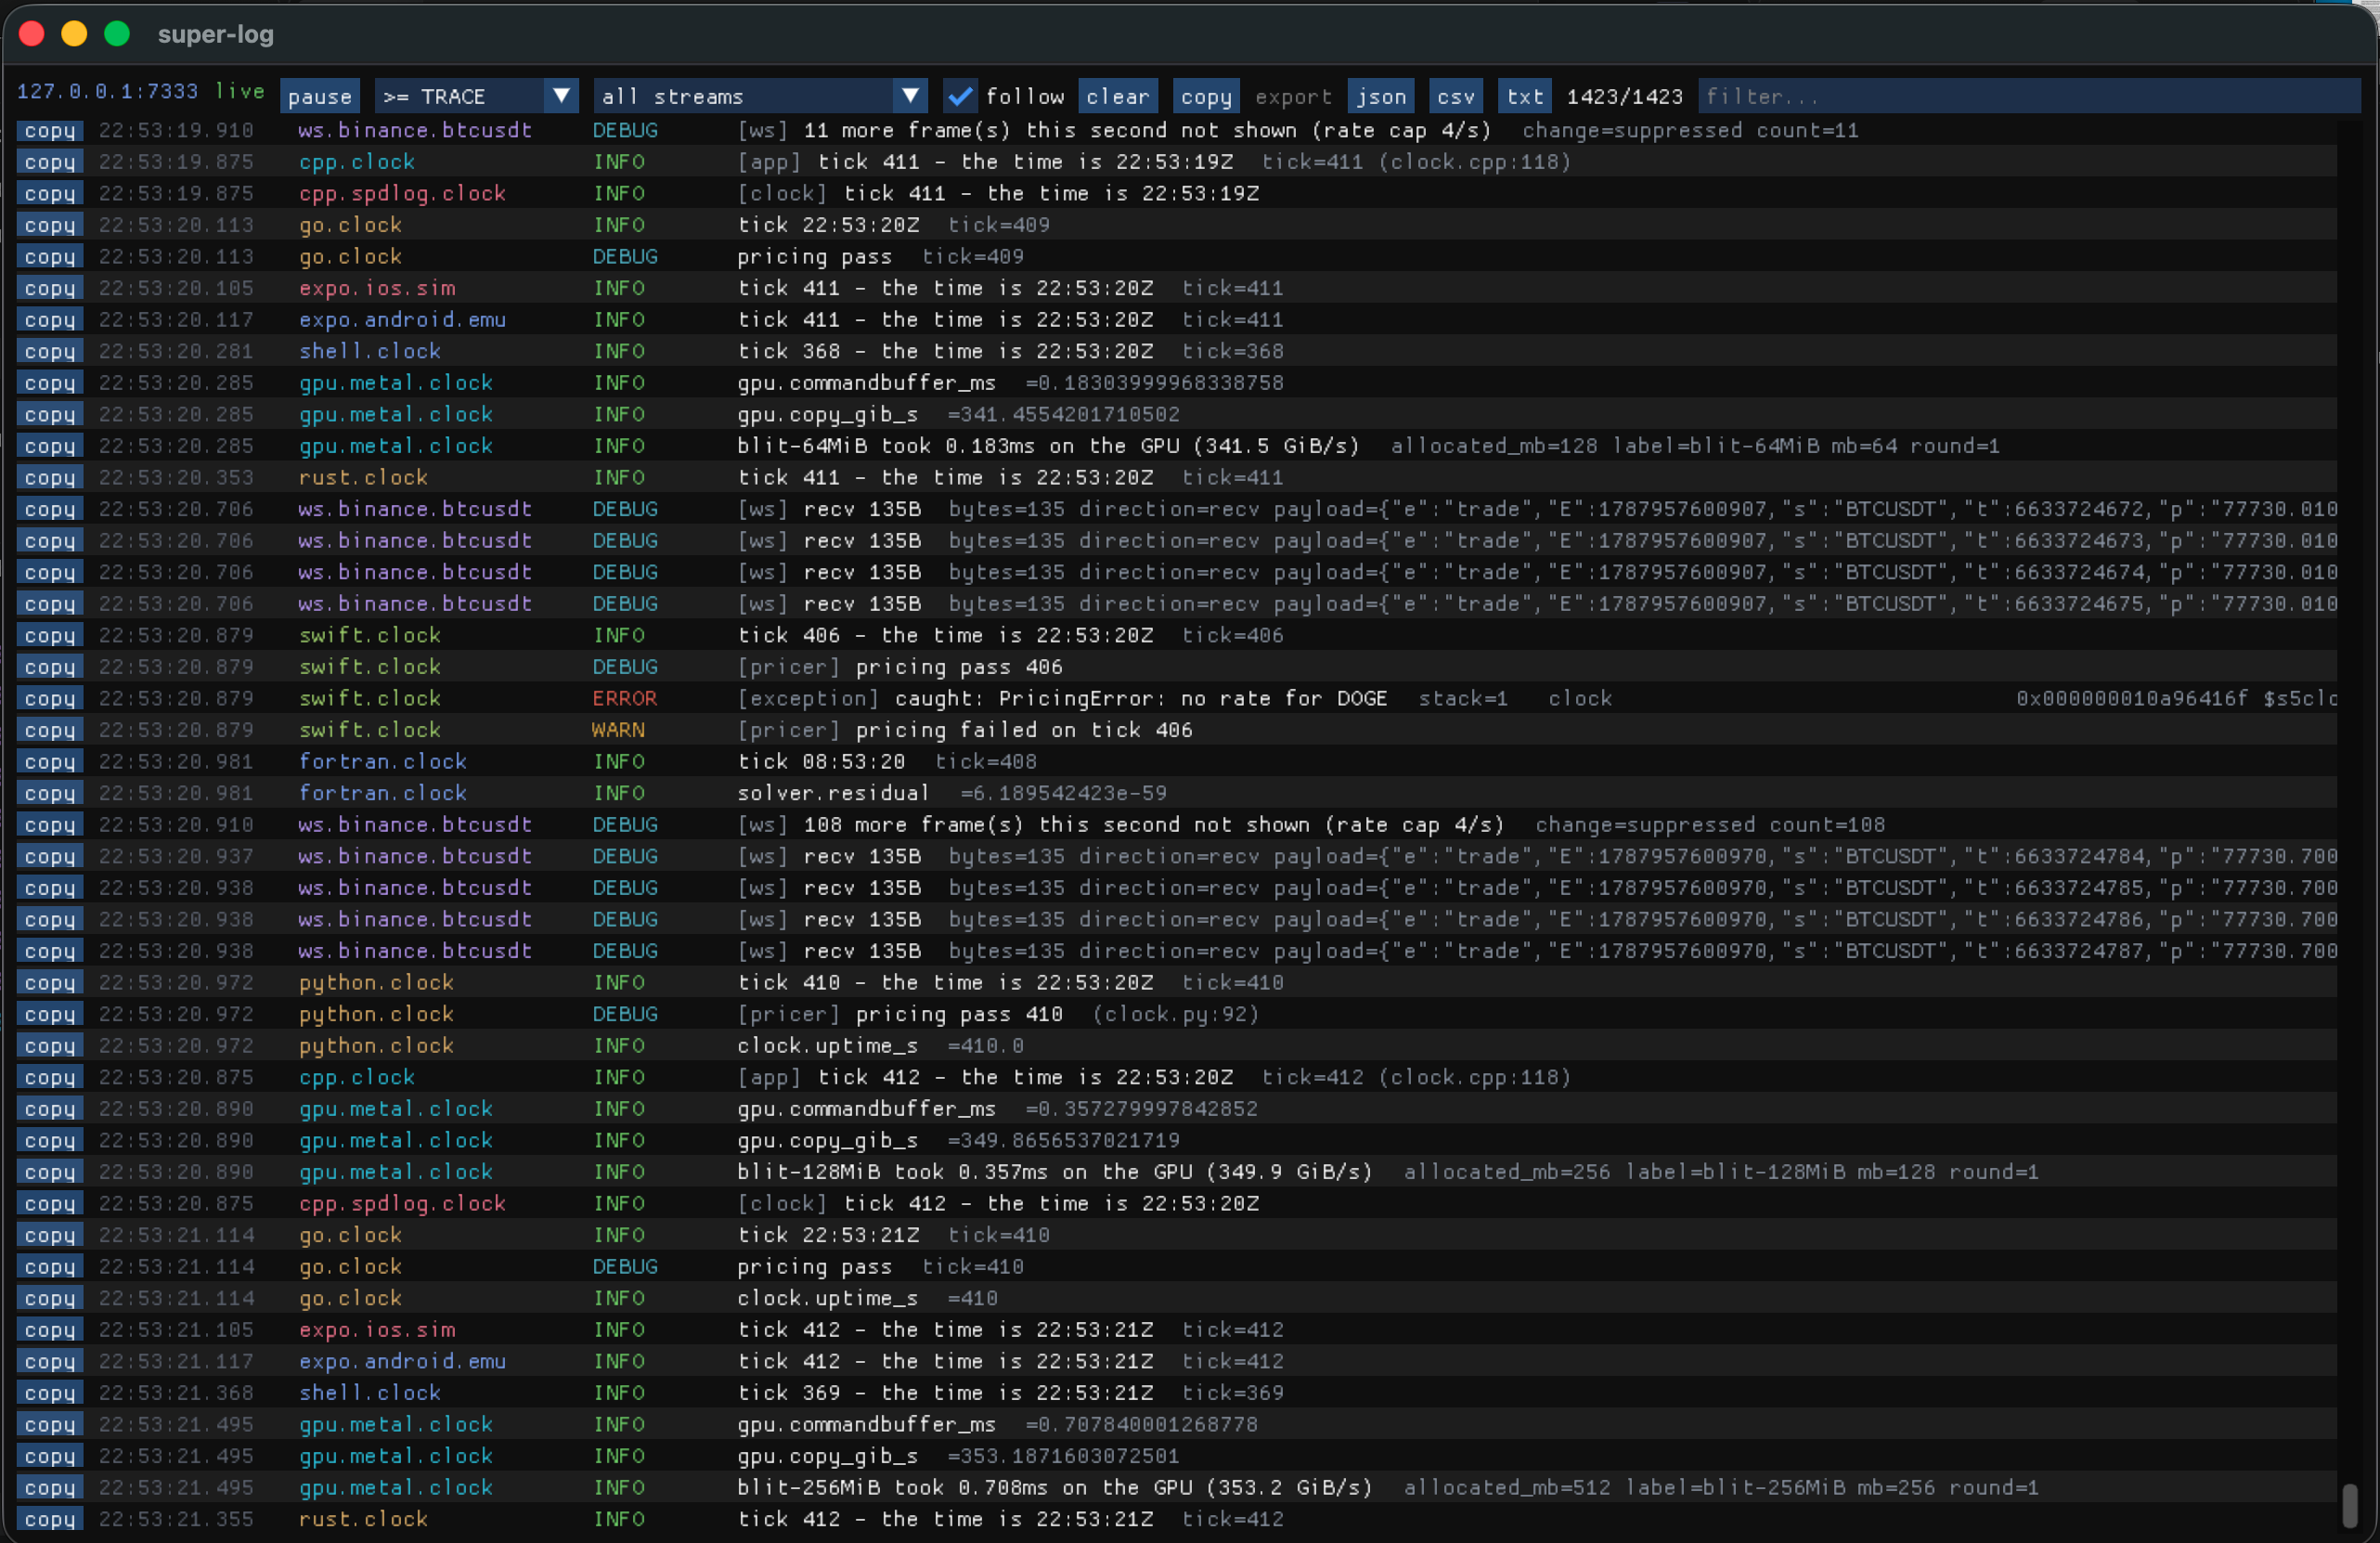
Why the interleaving is the point. In the middle, one Swift tick unfolds in order — the tick at INFO, a DEBUG pricing pass, the ERROR its exception raised, and the WARN that followed — while eleven other producers keep writing around it. Reconstructing that sequence from separate terminals is the ritual this replaces.
Follow one action across every tier. A tap becomes a request, a database
write and a chain call on four streams. withTrace() mints a correlation
id, carries it across awaits, and puts it on outbound HTTP automatically;
a server adopts it and logs under the same id. Then one query — a ⇢ in the
viewer, GET /recent?trace=…, or an agent tool — returns the whole story in
order.
Every error, including the ones nobody logged. Uncaught exceptions and
unhandled rejections are captured by default in every SDK, with whole
stacks — not clipped to the throw site, because a deep React Native render
error runs 100+ frames through the bridge and that path is the thing you
actually need to paste. Capture chains to whatever was already installed, so
React Native still shows its red box, Node still exits 1, and C++ still aborts.
C++ traces are demangled (pricer::Engine::quote(int)) with no boost
dependency. For the hardest class — an exception a library throws and a
component boundary catches and displays, so it never reaches the global
handler — wrap the tree in SuperLogErrorBoundary (or forward your own
boundary's componentDidCatch to log.exception): that lands the component
stack too, the one thing a JS stack never contains — it names the component
that threw. Plus an opt-in breadcrumb on every Error construction.
Zero-app-change fallbacks. Host-side tailers scrape what already exists:
adb logcat (scoped to one app, because an OEM handset emits ~600 lines a
second), the iOS simulator's log stream, the macOS unified log, journald,
Docker containers, and any log file. A catalog knows where ~20 common
services log on macOS and Linux — postgres, mysql, mongodb, redis, nginx,
apache, kafka, elasticsearch, rocksdb — including both Homebrew prefixes.
The catalog also knows the engines and content tools: Unity's
Editor.log (the C# compiler's error CS1234 becomes ERROR, a thrown
exception too, while a folder named "Exceptions" stays INFO) and Unreal
Engine's per-project editor logs (LogNet: Warning: maps by Unreal's own
verbosity words, category kept). Blender logs to stdout — that is what the
tee is for — and AutoCAD's LOGFILEMODE file tails like any other.
Whole fleets, pulled over ssh. One config file brings up every stream on every server: OS logs, service logs, container logs. Nothing is installed remotely, no port is opened, and the servers never need to reach the hub — so the hub can stay loopback-bound while still watching production.
HTTP calls, request and response. Front a service with the logging proxy
and every call is one event (method, path, status, latency, size), or turn
on patchNetwork in the app and see the calls it makes. HTTPS targets need
no certificate work. Bodies are opt-in; credentials are always redacted.
Blockchain addresses, beside the code that touched them. Watch any EVM address and its transfers, contract events and native balance moves land on the same screen, in hub order, next to the app code that sent them.
Operational keys that never silently run dry. A keeper or oracle out of
gas stops a production system as surely as a crashed server, and it fails
politely — it just stops, and nothing says why. superlog-gas polls the
balances you name (native coin or ERC-20, per chain, per key, from a
gitignored config — a labelled key list is a map for an attacker) and
applies the bench's discipline: readings are metric events for the chart,
crossing your fund-now line is CRITICAL said once, your low line WARN
once, and refunding is announced. One JSON-RPC batch per chain per poll,
because a public RPC's rate limit is part of the design surface.
Infrastructure that only speaks when something changes. DNS records and TLS expiry, listening ports and the processes that own them — all watched by diffing snapshots, so the stream is silent until it matters: an NS record you did not change, a certificate three weeks out, a new public listener on a production box, a service that restarted without saying so.
Builds as events, not walls of text. Wrap any build — cmake, clang, gcc,
cargo, npm, xcodebuild, local or over ssh — and compiler diagnostics become
WARN/ERROR rows with file:line, with one summary event carrying exit
status, duration and counts. Linking included: GNU ld's undefined reference and multiple definition carry no severity word and would
otherwise scroll past as INFO; they, Apple's Undefined symbols and
duplicate symbol, lld, collect2, and the driver's own
clang: error: linker command failed all land as ERROR. Debuggers ride the
same rails: pipe a batch session through the tee —
gdb --batch -ex run -ex bt ./app 2>&1 | superlog tee --topic dbg.app --classify
(lldb likewise) — or tail gdb's set logging file like any other.
Massive downloads, watched. A 70B model from Hugging Face is fifteen
shards and half a day of \r-rewritten progress bars that exist only on the
terminal that started them — and tqdm, curl and wget all mute or reshape
those bars the moment their output is a pipe, so tee sees nothing. Wrap
the fetch in superlog-dl and percent, bytes and rate become metric events;
or point --watch at the destination directory and progress is measured at
the filesystem, which no tool can mute and which is the only honest
aggregate when every shard resets its own bar. The event that matters most
is the stall: no bytes for 30 seconds is a WARN on the bench — hours
before the fetch's own patience runs out at 97% of 140GB.
Watts, thermals, and who is drawing them. On macOS every bench run
samples CPU package power, die temperatures, fan RPM, aggregate CPU as one
number, and the top energy consumers — because a runaway process announces
itself through the fans long after a chart would have caught it (see the
power row below for the incident that earned this).
The machine's own life events. Crash reports and kernel panics parsed
out of DiagnosticReports — process, exception, signal — the moment they
land (and from the recent past at startup, because a crash writes its
report before the reboot that restarts the watcher); the previous
shutdown cause once per boot, translated (cause -128: uncontrolled power loss) and ERROR when unclean; volume mounts, unmounts and renames — a
rename moves every path on the volume, which is how long writes die with
nothing recording why; and sleep/wake, which explains every gap in every
other stream. This bench crashed four times with all of that evidence
sitting unread; the first live run surfaced an unclean shutdown and 38
crashes from the preceding three days. The demo starts it unconditionally
on macOS, beside power.
Files, and the lines that changed. A generated header, a lock file a
tool rewrote, a config a script overwrote — superlog-watch puts the
change in the same ordered stream as the build that then failed, and with
--diff it says which lines: one event per hunk, removed and added
together, every hunk of a save sharing a trace with its modified event
so one query returns the whole edit. Idempotent by content hash — a
rewrite that changes no bytes publishes nothing, which an mtime watcher
cannot promise.
History, not just the last few minutes. The journal writes every frame
verbatim to disk; search reads it back with the same filters as the live
feed (including --trace), and replay re-publishes it at original pace.
A 1 GB / 4.8M-event journal searches in ~2.3 s.
Readable by scripts and agents. GET /recent?since=<cursor>&level=ERROR
answers "what happened since I last looked", with a cursor that never misses
or repeats an event.
An MCP server, so a coding agent can read the bench. Seven tools, and
the shape of them matters: an agent's context is small and a firehose is
not, so every tool filters first, caps its output, and returns one compact
line per event. The documentation is queryable too: stream_guide explains
any capability in detail — what power.*'s metrics mean, why a dl.*
stall escalates, why a diff can be silent — from
guide.json, and the same file's playbooks
(triage, follow-a-trace, silent-stream…) are served as native MCP prompts.
Every logging capability ships with an entry there, so an agent never has
to guess what a topic means.
| Tool | For |
|---|---|
hub_status | Is the bench even up — "hub is down" vs "the app logged nothing" |
list_streams | Orientation: which topics are live, their level mix, which have errors |
tail_logs | Recent events by topic/level/text, with a cursor so repeat calls only return what is new |
search_logs | Find by text when you know the message but not the stream |
search_history | The on-disk journal — hours or days, for "what happened at 3am" |
wait_for | Block until a matching event arrives, instead of sleeping and hoping |
list_webhooks | The alarm gateway's routes with public URLs and health — the URL to hand a webhook sender, without asking a human |
agent_report | Put yourself on the agents blotter: which LLM you run on, status, task, percent, and the cadence you promise — the one write this server performs, agent.* only |
stream_guide | The bench's own manual: detailed per-capability docs and playbooks, fetched on demand |
npm run demo:mcp        # drives all six over stdio and prints what an agent sees
# from a clone:
claude mcp add super-log --scope user -- node $PWD/sdk/js/packages/mcp/bin/superlog-mcp.mjs
# or, once published, with no clone at all:
claude mcp add super-log --scope user -- npx -y @super-log/mcp
Registered once per machine, not per project: one hub serves every project
and agents narrow by topic prefix. Read-only by construction — with one
deliberate, narrow exception: agent telemetry, which can land only on
agent.* status topics (see the agents blotter below) — and
dependency-free — MCP over stdio is newline-delimited JSON-RPC 2.0.
Already on OpenTelemetry? Join with one exporter stanza, no new SDK.
superlog-otlp is an OTLP/HTTP server on the standard 127.0.0.1:4318,
so pointing an existing exporter at it needs zero endpoint config:
OTEL_EXPORTER_OTLP_ENDPOINT=http://127.0.0.1:4318. It speaks both
OTLP/JSON and OTLP/protobuf (a hand-rolled bounded decoder, because most
SDKs default to protobuf), maps severityNumber to bench levels, and
turns each resource's service.name into an otlp.<service> topic. The
detail that makes it more than a gateway: an OTel span's trace_id
becomes the event's trace, so it lines up with withTrace()'s own ids
— one /recent?trace= returns the OTel spans and the bench's lines as a
single story. Metrics arrive as metric readings (histograms summarized
to count and sum, never invented percentiles); spans as trace-carrying
DEBUG events, because this is an inlet, not a span store.
Something reaches you when nobody is watching. Rules over the live feed
fire through one channel registry — console, desktop, webhook, command
today; Telegram, Twilio SMS / WhatsApp and email are config-gated entries
in the same registry (superlog-alert --channels prints the roster and
exactly what each missing channel needs) — and back onto the bench as
alert.*. Four rule shapes, because production breaks in four ways:
something bad was logged, too much of it was logged, something
stopped being logged (a quiet server and a dead server look identical
until you check), and several things happened together — a combo
rule fires when all its conditions land inside one window, the correlation
("a deploy happened AND errors spiked") no single filter can say.
Production can raise the alarm, without logging a thing. Every SDK's
PRODUCTION mode ships nothing by design — but an ALARM is not logging, it
is a rare deliberate act, and superlog-alarm is its door: a token-guarded
public webhook through a Cloudflare tunnel — a quick tunnel with zero
config, or a stable named tunnel auto-provisioned via the API given a
token. Cloudflare is the verified, daily-driven path: quick tunnels, the
named tunnel, DNS provisioning and the endpoint factory all run against it
on a real bench. --tunnel ngrok and --tunnel zrok exist as code paths
but have not been driven the same way yet — see Future directions. One
curl from any language fires
alert.inbound.<name>; the same key re-firing is one alarm with a
repeat count, not 113 pages; recovery closes the loop; and every checker
can POST a heartbeat so the gateway itself raises monitor_dead:<name>
when a watcher goes silent — the alarm the dead watcher cannot send. Both
viewers carry an alarm blotter — a sparse panel, deliberately unlike
the firehose, one row per key — with a test-alarm button that proves
the whole path step by step: hub, tunnel, a real round-trip from the
internet back through the public URL, the notification channels (including
the diagnosis when your own router's DNS filters the tunnel's name while
production's resolves it fine), and then every route on the books, each
with its own verdict — a capture endpoint passes only when a probe posted
through its public URL lands back on the hub as a wh.<name> event, a
forwarded port that answers 502 is reported as "tunnel up, your service is
not", and a watch-only URL passes on any HTTP answer, because any answer
proves the wire.
The gateway is also an endpoint factory, and the viewers split its two
audiences: alarms (production) — the sparse blotter plus the alarm
path's own routes — and webhooks (development) — the endpoint grid and
a live feed of every captured delivery with its payload, signature verdict
and relay status. Both are toggled from a menu bar that the ImGui and
React viewers render from the same declarative
viewer/menu.json — alongside an agents blotter
(View → Agents): every agent working the bench, one row each — name,
which LLM it runs on, latest status, last seen. MCP consumers appear
the moment they connect (the server announces its own initialize
handshakes) and their tool calls show as requesting events; anything can
report via the agent_report MCP tool or one POST to agent.<name>,
declaring its LLM, task, percent, and the cadence it promises — every 15
minutes by default, plus on events, which is how an 8-hour job stays
visible. The freshness light is held to each agent's own promise:
green inside 2×, late, then silent — an agent that broke its own word
looks like it. And a servers board:
every event carries origin.device, so the hub's traffic is the server
list — one row per machine with a recency light (up / quiet /
silent), last seen, and the loudest level of the last minute,
whatever the mechanism that produced the events (a vitals reading, a ping
metric, an app's own SDK). "Is the build box fine" becomes one glance;
when the answer is grey, the detailed logs are one topic filter away in
the firehose — and a silence rule in alerts.json is what turns grey
into an alarm. Every route is a grid row —
status : route : url : seen : ping — expandable into full diagnostics,
with ping (measure this route now, on the same watchdog books),
copy (the full public URL) and delete buttons, each route pinged on
its own configurable clock (two consecutive failures raises
tunnel_down:<name>, recovery clears it). + endpoint provisions in
one click — a name alone captures deliveries as wh.<name> events (paste
the URL into a Stripe or GitHub webhook form and watch them arrive), a
name plus port forwards a local service. Many endpoints live better in a
file: npm run alarm -- --provision endpoints.json applies a declarative
manifest ({"name":"stripe"} capture, {"name":"webapp","port":5173}
forward, {"name":"partner","url":"https://…"} watch-only, each with
optional interval_s) and keeps it applied as the file changes — new names
appear, removed names are torn down, though only names the file created.
endpoints.json.example shows every shape; the
real file is gitignored because names, ports and signing secrets describe
the bench. Every URL the gateway currently owns is rewritten to
endpoints.env (gitignored) on every change, so scripts and agents
can simply source it — and agents can also just ask: the MCP server's
list_webhooks returns the roster with public URLs and health.
Webhook testing, done properly — Stripe as the worked example. A
capture endpoint alone is already a webhook inspector: paste its URL into
the Stripe dashboard (or stripe trigger payment_intent.succeeded at it),
and every delivery lands as a wh.stripe event with method, headers
(stripe-signature kept) and up to 32KB of body — a real invoice event
runs 5–15KB and arrives whole. Two additions make it a development tool
rather than a peephole. Give the endpoint your signing secret
("secret":"whsec_..." in the manifest, or STRIPE_WEBHOOK_SECRET) and
the gateway verifies the Stripe signature scheme on arrival: each
event carries sig: verified or sig: FAILED (WARN), with stale
timestamps flagged as possible replays — and no secret means the field
stays absent, never a fake verdict. Give it a relay
({"name":"stripe","relay":5000} or a full URL like
http://127.0.0.1:5000/webhook) and each delivery is also handed to your
local handler, whose real response goes back to Stripe — stripe listen --forward-to, except every delivery, signature verdict and your
handler's status code are on the bench, in order, beside your app's own
logs. A handler that is down shows up as relay unreachable at WARN — the
exact finding a webhook test exists to produce. (local: true skips the
tunnel entirely when the bench only needs to test against itself.)
GitHub's scheme (x-hub-signature-256) verifies beside Stripe's against
the same secret; other providers are one clause each.
The webhooks panel's deliveries feed is built for reading the results: filter by endpoint and by level exactly like the main log (WARN isolates the failed signatures and unreachable relays), expand any delivery's payload in place, and copy — one button per delivery, one for the whole filtered set — hands you paste-able evidence: the feed line, the signature and relay verdicts, then the payload verbatim. The whole loop is exercised end-to-end with the Stripe CLI:
stripe listen --print-secret            # the whsec_... for endpoints.json
stripe listen --forward-to http://127.0.0.1:7336/hook/stripe-test
stripe trigger payment_intent.succeeded # real events, signatures verified
Producers never block. Every SDK uses a bounded queue that drops oldest under burst — counted, never hidden. A logger that can stall the app it observes is worse than no logger.
Off in production, by construction. Every SDK requires you to declare DEVELOPMENT or PRODUCTION (neither or both refuses to build), and each mode ships only what its policy allows. Production defaults to nothing.
What this is, and what it is not
It is a development tool. The bench you sit at: everything your machine and your devices are saying, on one screen, in the order it happened, while you are working. It is optimised for the ten seconds after something breaks — one hub, no schema to declare, no agent to install, a stream added by typing one command, and nothing to configure before the first line appears.
It is not an observability suite, and should not be used as one. The distinction is not modesty, it is design: several things that make it good at the first job make it unfit for the second.
| super-log | Prometheus / Grafana / Loki / Datadog | |
|---|---|---|
| Lives | on your machine, while you work | in production, permanently |
| Retention | a ring in memory, plus a journal you turn on | months, indexed, queryable |
| Auth | none — loopback by default | tenants, RBAC, audit |
| Scale | one bench, a handful of servers | thousands of hosts |
| Alerting | rules for "tell me while I am here" | on-call, escalation, SLOs |
| Cost of adding a stream | one command | a pipeline change |
Concretely, do not point this at production and walk away. The hub has
no authentication: anyone who can reach the port can read every stream and
publish to any topic. It keeps 2000 events per topic in memory and forgets
the rest unless the journal is running. Throughput, though, is not the
limit that stops you: on one developer machine a single hub ingested a
250-machine fleet's burst — 500,000 events in 2.3 seconds (~217,000
events/second, 67 MB/s), none dropped — and a level-filtered /recent
still answered in 16 ms while it arrived
(bench/loadtest.mjs — reproduce it yourself against a
throwaway hub). What makes it unfit for production is the two sentences above,
no auth and an in-memory ring, not the ingest path.
What it is fair to do in production is pull: the ssh tailer and the fleet runner read remote logs onto your bench over ssh, so production never needs to reach the hub and the hub never needs to be exposed. That is how the fleet support is meant to be used.
When you outgrow it, you have not wasted anything — the wire format is NDJSON on plain HTTP (see docs/PROTOCOL.md), so a forwarder into Loki, Elasticsearch or an OTLP collector is a small script that subscribes to the firehose and re-posts. The two tools answer different questions and it is reasonable to run both: this one for "what is happening right now while I am looking", that one for "what happened last Tuesday at three in the morning".
Collection is not analysis — and that is the whole design
super-log does one thing: it collects and consolidates. Every stream a bench produces, on one wire, in one order, on one screen. It deliberately does not analyse — no query language, no dashboards to build, no rules engine you must program before the first insight. That separation is not a missing feature; it is the point. Collection should be dumb, fast, and trustworthy; analysis is a different job with different tools, and coupling the two is how logging stacks become the thing you have to operate instead of the thing that helps you operate.
This is the opposite of the log4j lesson. The Java logging world put a large, powerful, evaluating framework inside every application — and in 2021 the world learned what that costs, when a string in a log message became remote code execution (log4shell) across half the internet. The framework that was supposed to observe the app could compromise it. super-log inverts every part of that:
- Logging lives outside the app. A super-log producer is a thin, zero-dependency SDK — often just one file, or no code at all: point an existing OpenTelemetry exporter at it, or tail a file. There is no heavy framework in your process to be a liability.
- Content is data, never code. Every parser on the collection side is bounded and treats input as bytes to be stored, never expressions to be evaluated — the log4shell class of bug is structurally impossible here.
- Production ships nothing by default. Every SDK is DEVELOPMENT-xor-
PRODUCTION, and PRODUCTION is an inert shell that sends nothing until you
opt a level in — the compiled languages compile the wire code out
entirely, provably (
stringsfinds no endpoint in the binary).
So the app stays simple and safe, the bench stays a bench, and what you do with the consolidated stream is a clean, separate choice — eyeball it, forward it to your long-term store, or hand it to something that reasons about it.
super-log.com — analysis and AI, for teams
The open-source bench is the collection and consolidation layer, free and self-hosted, forever. super-log.com is the analysis layer built on top of it — the commercial service for when a consolidated stream is more than one person can watch:
- Real-time LLM analysis of the consolidated log. An AI reads the whole interleaved firehose as it happens — every service, device and chain at once — and tells you what changed, what correlates, and what is about to break, in the plain-language a teammate would use. The thing a human does in the ten seconds after something breaks, done continuously across streams no human can watch all of.
- Built for teams. One consolidated view of everyone's benches and services, shared context, history that outlives a laptop, and alerting that reaches the person who can fix it. The servers, agents and PR boards in the open-source viewers hint at the shape; the hosted service makes them a shared, durable, analysed surface.
- Same clean boundary. super-log.com consumes the exact same NDJSON wire the open-source hub speaks — nothing new to instrument. Your collection stays yours and self-hosted; you choose to send a stream up for analysis, and you can stop at any time. Collection and analysis stay separate all the way through.
The open-source project is complete and useful on its own — the commercial service is analysis you would otherwise build, not a paywall around the bench.
Install
The fastest way onto the bench — Homebrew — and a runnable example in the same breath:
brew install saxonnicholls/tap/super-log     # the hub + all the tailers

# See it work in three lines:
brew services start super-log                        # hub on :7333
echo "the bench is live" | superlog tee --topic hello    # a line of your own
curl -s "http://127.0.0.1:7333/recent?topic=hello"   # read it back

# Then put your machine on the bench — any of these, immediately:
superlog-netstate      # gateway, Wi-Fi, VPN, resolvers — changes only
superlog-otlp          # OpenTelemetry inlet on :4318
your-build 2>&1 | superlog tee --topic build    # anything that prints
Other channels, each landing the hub and the tailers:
# npm — the tailers and the MCP server as commands, anywhere Node ≥18 runs
npm install -g @super-log/tailers @super-log/mcp

# Ubuntu (incl. Ubuntu Server on a Pi) — the PPA: apt install super-log, every
# architecture Launchpad builds (arm64 included), with apt upgrade after.
sudo add-apt-repository ppa:super-log/stable
sudo apt update && sudo apt install super-log

# Debian / Raspberry Pi OS — PPAs are Ubuntu-only (no add-apt-repository here),
# so take the .deb from the release (apt, not dpkg -i, so nodejs and libatomic1
# come with it). Pick your arch — arm64 for a 64-bit Pi, amd64 for x86:
curl -fsSL -O https://github.com/saxonnicholls/super-log/releases/download/v0.4.0/super-log_0.4.0_arm64.deb   # or _amd64.deb
sudo apt install -y ./super-log_0.4.0_arm64.deb

# Fedora / RHEL / Rocky / Alma — dnf takes the URL directly:
sudo dnf install -y https://github.com/saxonnicholls/super-log/releases/download/v0.4.0/super-log-0.4.0-1.fc41.x86_64.rpm

# vcpkg — the SDK for C/C++ (incl. Windows/MSVC). C header by default;
# [cpp] adds the header-only C++ SDK (pulls the ts-moveables vcpkg port).
vcpkg install super-log          # the zero-dependency C header
vcpkg install super-log[cpp]     # + the C++ SDK (event model, SN_LOG)
Pick the .deb for your architecture (dpkg --print-architecture). On a
systemd host the hub starts on install; in a container without systemd, run
superlogd yourself.
On install the hub binds loopback (127.0.0.1) — right for a dev box, but
if this machine is the collector other devices ship logs to over the LAN (a
common Raspberry Pi role), they cannot reach it until you bind the network: set
SUPER_LOG_LAN=1 (or SUPER_LOG_BIND=0.0.0.0) in the service environment and
restart superlogd. The failure is silent at both ends — the device shows
"never reported" and the hub logs nothing — so if you are standing one up as a
LAN sink, see docs/DEVICES.md for the "loopback trap" and how
to make the LAN binding persist across restarts.
The MCP server also runs straight from npx, no install:
claude mcp add super-log -- npx -y @super-log/mcp. The viewers (native
and web) come with a clone — see Quick start below. Packaging sources and
the maintainer publish steps live in packaging/.
Quick start (from a clone)
git clone --recurse-submodules --shallow-submodules <this repo>
cd super-log
cp .env.example .env             # optional: chain endpoints, hub defaults

# The one-command install: preflight the toolchain, build the hub and
# viewer, and verify every SDK actually delivers to a real hub before
# calling itself done. Add --persist to start the hub and the default-on
# tailers at login and keep them running across reboots.
./scripts/install.sh             # build + verify
./scripts/install.sh --persist   # ...and run at login, forever

# The whole demo: hub, C++/Rust/iOS/Android/browser/container clocks,
# OS-log streams, both viewers - one command
npm run demo                     # see demo/README.md for the tour

# ...and the other languages on the same screen, if their toolchains are here
SUPER_LOG_LANGS="go python java swift fortran shell" npm run demo

# Or piece by piece:
./scripts/dev.sh                 # build + run the hub
npm install && npm run viewer    # web viewer on http://localhost:7334
npm run tail:android             # first stream: the Android emulator
The demo binds to loopback. Real phones need the hub on the LAN:
SUPER_LOG_LAN=1 ./demo/run.sh — read the security section first. The
viewer finds the hub from the host that served the page, so opening it from
another machine needs no configuration.
Configuration files
Most streams need no config — you just run them. A handful that carry
secrets (API keys, RPC URLs with keys, wallet addresses, tokens) read
a file that is gitignored, so your credentials never reach a commit.
Every one ships a .example twin beside it: copy, then edit. That's the
whole ritual — cp <name>.example <name>, fill in your values, run.
| Copy this → to this | For | What goes in it |
|---|---|---|
.env.example → .env | the hub, chains, alarms, and every API-keyed tailer | Hub URL/bind, chain RPC endpoints, Cloudflare/Stripe/Twilio/Telegram creds, PR logins, Starlink dish, notification channels — each block is commented, and anything left blank is simply not watched. |
rpc.json.example → rpc.json | npm run rpc — RPC node health | Per chain, per provider, a {chain, provider, url, kind?}. Two providers per chain (a QuickNode and an Alchemy) is the point — the board shows which one died. The URL shapes are pre-filled; paste your key. |
gas.json.example → gas.json | npm run gas — key balance / fund-now alarms | Per chain, the operational keys to watch with crit/warn thresholds. EVM, Solana, Tron, Bitcoin (kind). A labelled key list is a map for an attacker even when the addresses are public — hence gitignored. |
alerts.json.example → `alerts.js |
Installation
Source-derived launch command. Check the maintainer’s required arguments and credentials before running:
npx -y @super-log/mcpSet up in your AI client
Merge this template into ~/Library/Application Support/Claude/claude_desktop_config.json. Keep existing servers. Add any arguments, credentials, and permissions required by the maintainer; this template has not been install-tested.
{
  "mcpServers": {
    "com-super-log-super-log": {
      "command": "npx",
      "args": [
        "-y",
        "@super-log/mcp"
      ]
    }
  }
}
Restart Claude Desktop completely for changes to take effect. Confirm the server appears connected in the client’s tool list, then try a read-only example from its documentation.
Claude Desktop setup referencePackage
@super-log/mcpnpmCompatible MCP Clients
com.super-log/super-log works with any MCP-compatible client. Copy the config snippet from the Configuration section above and add it to the file shown for your client, then restart the application.
- Claude Desktop
~/Library/Application Support/Claude/claude_desktop_config.jsonRestart Claude Desktop completely for changes to take effect. - Cursor
~/.cursor/mcp.jsonRestart Cursor for changes to take effect. - VS Code
.vscode/mcp.jsonReload VS Code window for changes to take effect. - Windsurf
~/.codeium/windsurf/mcp_config.jsonRestart Windsurf for changes to take effect. - Claude Code
.mcp.jsonSave at the project root, then start Claude Code in that project and review the MCP server approval prompt. Keep real credentials out of shared files.