io.github.brownglasses/dotplot-mcp
Product analytics for user flows: aha moments, retention, funnels, per-user dot plots. YC method.
Dot Plot MCP
See individual users, not aggregate charts.
English | 한국어
Install
Paste this to your agent and it sets everything up:
Set up Dotplot (MCP + skills) — instructions are here https://dotplot-reports.vercel.app/setup.md
Or do it by hand
claude mcp add --scope user dotplot -- uvx dotplot-mcp
Use
Say this in any project:
"Analyze my product"
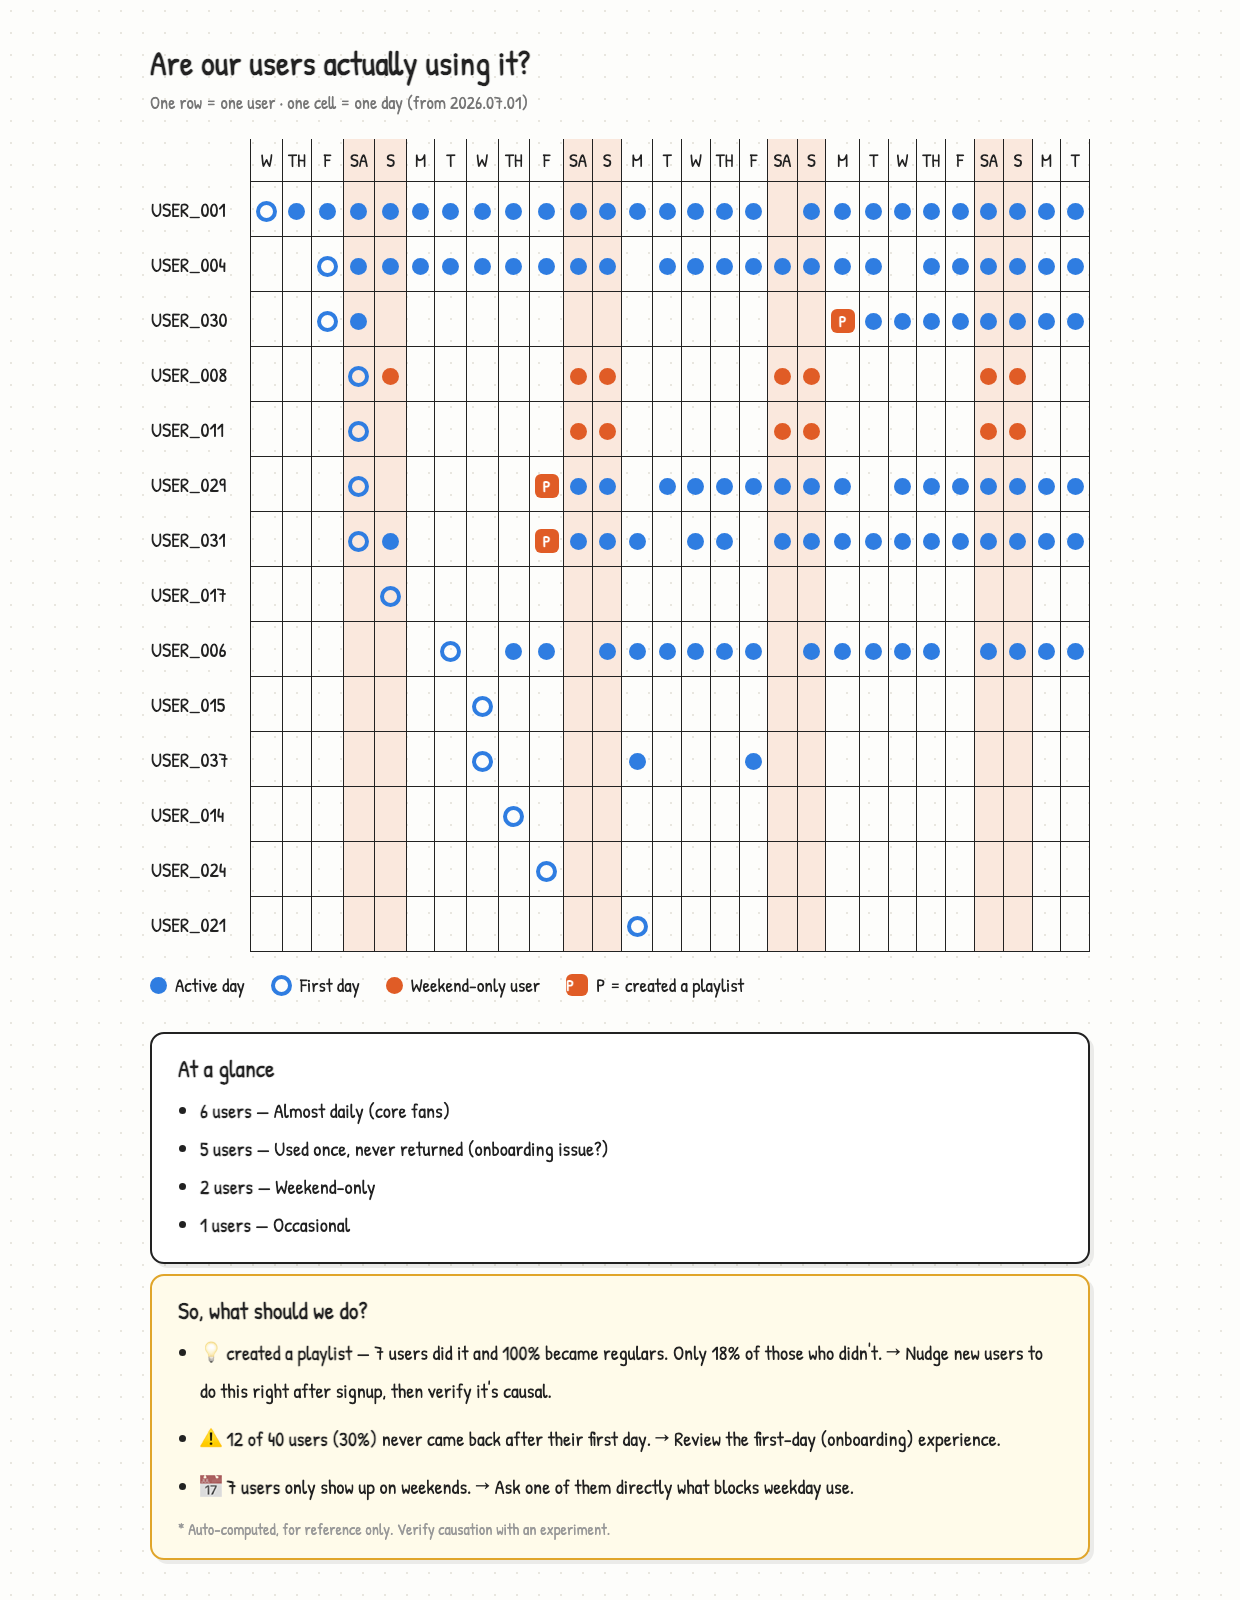
You get the report above. That's it.
Or use the slash commands:
/dotplot-analyze-product    full analysis and report
/dotplot-add-tracking       find and write the logging you're missing
/dotplot-whats-changed      compare with the previous report
Claude finds your data, picks the action that means "this user got value", and
writes the report. No events table needed — your orders table already is one:
SELECT user_id, created_at::date AS date, 'purchase' AS event FROM orders
UNION ALL
SELECT user_id, added_at::date, 'add_to_wishlist' FROM wishlist_items
Nothing tracked yet? Say "add the tracking I'm missing" and Claude reads your code, writes the logging that's absent, and tells you when to come back.
No product to analyze yet? Try the sample
git clone https://github.com/brownglasses/dotplot-mcp && cd dotplot-mcp
uv run sample_data.py   # 40 fake users with a pattern planted in them
uv run harness.py       # watch the whole pipeline run
Why this exists
DAU/MAU charts go "up and to the right" as long as new users arrive — even when nobody stays. Until you have hundreds of users, the most informative dashboard is YC's dot plot (David Lieb): one row per user, one cell per day.
Four rules keep it honest:
- Code computes, AI only interprets — same data, same numbers, every time
- Small samples withhold judgment — under 5 users in a group, it says nothing
- Correlation isn't cause — every finding ships with "test this before you believe it"
- Vanity metrics are refused — pick
open_appas your value event and the code says no
Reports come out in your language (English, 한국어, 日本語 built in; anything else translated on the fly with the numbers verified intact).
More
MIT
Installation
Source-derived launch command. Check the maintainer’s required arguments and credentials before running:
uvx dotplot-mcpSet up in your AI client
Merge this template into ~/Library/Application Support/Claude/claude_desktop_config.json. Keep existing servers. Add any arguments, credentials, and permissions required by the maintainer; this template has not been install-tested.
{
  "mcpServers": {
    "io-github-brownglasses-dotplot-mcp": {
      "command": "uvx",
      "args": [
        "dotplot-mcp"
      ]
    }
  }
}
Restart Claude Desktop completely for changes to take effect. Confirm the server appears connected in the client’s tool list, then try a read-only example from its documentation.
Claude Desktop setup referencePackage
dotplot-mcppypiCompatible MCP Clients
io.github.brownglasses/dotplot-mcp works with any MCP-compatible client. Copy the config snippet from the Configuration section above and add it to the file shown for your client, then restart the application.
- Claude Desktop
~/Library/Application Support/Claude/claude_desktop_config.jsonRestart Claude Desktop completely for changes to take effect. - Cursor
~/.cursor/mcp.jsonRestart Cursor for changes to take effect. - VS Code
.vscode/mcp.jsonReload VS Code window for changes to take effect. - Windsurf
~/.codeium/windsurf/mcp_config.jsonRestart Windsurf for changes to take effect. - Claude Code
.mcp.jsonSave at the project root, then start Claude Code in that project and review the MCP server approval prompt. Keep real credentials out of shared files.